
The following article discusses the insights from EDA of crime incident data in England from 2011-2022. The pre-requisite for this project is the Crime Incident data which can be accessed via my previous posts in this site.
The snippet of the crime incident data from 2011 till 2022 is shown in Figure 1 below.
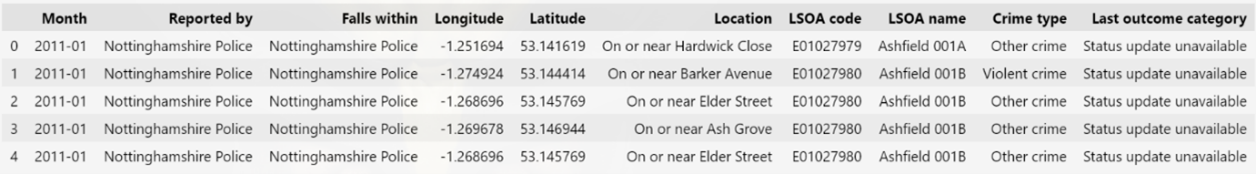 Figure 1: Snippet of Crime Incident Data
The initial and simplest way to visualize the data from 1 is to view the total number of crime incidents over time. Mentioned chart is plotted in 2 below.
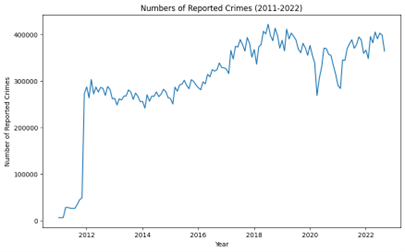 Figure 2: Number of Reported Crimes (2011-2022)
The information that can be inferred from Figure 2 is that there seems to be a sudden spike from 2011 to 2012, although that may be attributed to incomplete data for 2011. Other than that, there seems to be a massive drop in crime numbers during the Covid-19 outbreak in 2020 and interestingly, some sort of seasonal trend exists in the numbers. To dive deeper, Figure 3 illustrates the number of crime incidents stacked over each year, which allows for the viewing of trend across months.
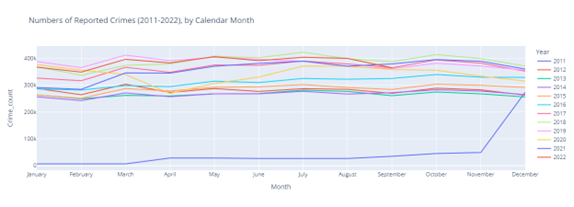 Figure 3: Number of Reported Crimes (2011-2022), by Calendar Month
From Figure 3, with the exception of crimes from 2011, it is visible that number of crimes drop during winter seasons (December - February). During spring season, March - May, the crime numbers slowly gather pace and peaks during summer seasons June - August. Towards the end of summer, the numbers show a slight drop before peaking again in Autumn (September - October). This seasonal cyclic pattern might be influenced by factors such as temperature, weather and environment which are out of this projects scope. To verify whether this seasonal cyclic pattern is applicable to all crime types, Figure 4 is plotted to illustrate the number of reported crimes by crime types.
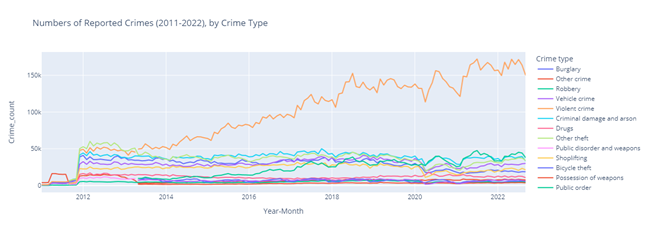 Figure 4: Number of Reported Crimes (2011-2022), by Crime Types
From Figure 4, it can be inferred that except for violence and sexual offences, almost all the other crime types obey the seasonal cyclic pattern that was observed in Figure 3. This might be explained by the fact that most crimes can only be committed by leaving the house whereas violence and sexual offences are not particular to location. It must also be noted that violence and sexual offences are the most common type of crimes committed in England while the least common is possession of weapons. Moving on to locations of the crimes, Figure 5 depicts the most common locations for a crime to take place in England.
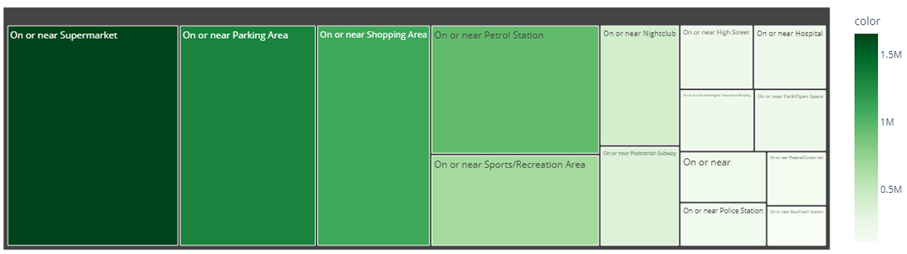 Figure 5: Most Common Locations for Crime in England (2011-2022)
It can be learned from Figure 5 that those locations in near proximity to a supermarket is the most common location for crimes in England for the past 12 years with approximately 1.5 million cumulative crime incidents. Closely behind are areas nearby parking area, shopping area, petrol station and sports/recreation area. Based on instinct, most people would have picked high risk areas such as nightclubs to be involved as the highest crime occurring location, but the obtained data disproves this notion and informs that public spaces are the highest occurring crime location. Further data such as time of the crime might help to shed further light on these occurrences, which is out of this projects scope. Mapping the number of crime incidents over time by lower layer super output area (LSOA) code gives a visual geographical sense of the crime state across England. Figure 6 illustrates this point by using a darker colour map on LSOA codes that has the highest numbers of crime incidents.
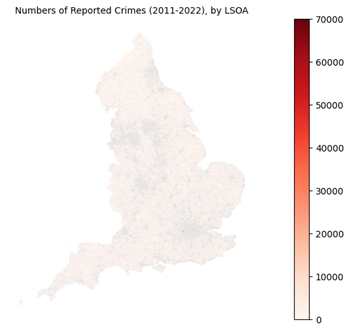 Figure 6: Number of Reported Crimes (2011-2022), by LSOA code
It is apparent from Figure 6 that the majority of LSOAs exhibit a similar crime incident distribution except for a select few points that are not readily obvious when viewing the country as a whole. The points in question are situated in south west of the map and by zooming in Figure 4.6, the visibility of the LSOA codes which constitutes of the highest number of crime incidents from 2011 – 2022 shall be enhanced and is appropriately illustrated in Figure 7.
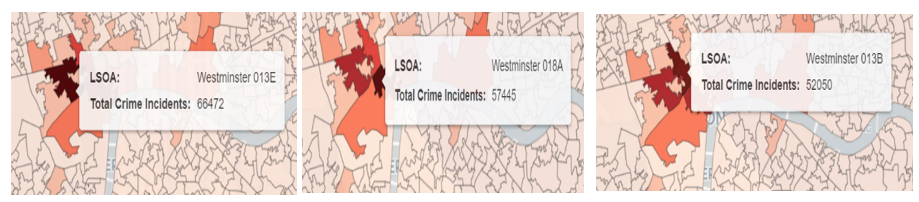 Figure 7: Top 3 Highest Crime Incidents Occurring LSOA
Zooming in to the dark red spots in Figure 7 shows the top 3 highest crime incidents occurring LSOA which are Westminster 013E, Westminster 018A and Westminster 013B. Interestingly here, the top 3 crime occurring areas are in very close proximity to each other which reiterates the theory that crime has the tendency to form a cluster.
The Python scripts to perform the EDA mentioned in this article are hosted in my Github Repo