The following article details the process on collecting deprivation index data in England from 2011-2022 in a single tabular file.
From English Indices, it can be understood that the indices of deprivation provide a set of relative measures of deprivation for lower layer super output areas (LSOA) across England based on seven domains of deprivation. The domains were then aggregated using the weights below which results in the Index of Multiple Deprivation (IMD) score,
- Income Deprivation (22.5%)
- Employment Deprivation (22.5%)
- Education, Skills and Training Deprivation (13.5%)
- Health Deprivation and Disability (13.5%)
- Crime (9.3%)
- Barriers to Housing and Services (9.3%)
- Living Environment Deprivation (9.3%)
There are a total of 16 scores or features that falls under the umbrella of deprivation scores and currently, there only exists the deprivation scores for years 2010, 2015 and 2019, while this project requires the deprivation scores from 2011 till 2022. The scores are interpreted to be as highest score as the most deprived and with the assumption that deprivation scores would not fluctuate much in the span of 4 years, the steps to work around this problem and adapting the scores for this project are,
- Deprivation scores for year 2010: The scores will be applied for years 2011 till 2014.
- Deprivation scores for year 2015: The scores will be applied for years 2015 till 2018.
- Deprivation scores for year 2019: The scores will be applied for years 2019 till 2022.
The file that contains the deprivation score can be downloaded directly in a .csv format. The example of download page is illustrated in Figure 1 below.
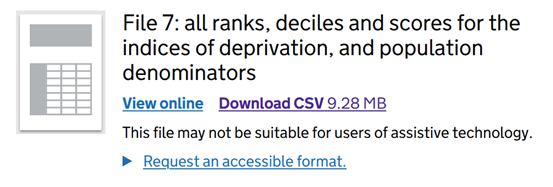 Figure 1: Example of download page for deprivation score 2019. Adapted from English Indices
With the steps above as the key concept, the actual steps in merging deprivation scores from 2011 – 2022 are,
- Loading all 3 datasets of 2010, 2015 and 2019 into each individual Pandas DataFrame.
- Renaming the column names on all 3 DataFrames to ensure consistency.
- For year 2011 to 2014, the DataFrame of 2010 are iterated in a nested loop. The first loop is the year and under that loop is the months in a calendar year. Under that final loop, a new column of month is created using the iterated month and year values. This DataFrame is then appended to a list and after that, the newly created column is dropped to return the DataFrame back to its original state.
- After the nested loop iterations are over, the appended lists of DataFrame are all merged together as one.
- Steps (c) – (d) is repeated for years 2015 – 2018 and 2019 – 2022.
- The resulting 3 DataFrames can now be merged together to give the deprivation scores from 2011 – 2022 by month and LSOA.
The snippet of the merged deprivation scores is shown in Figure 2 below.
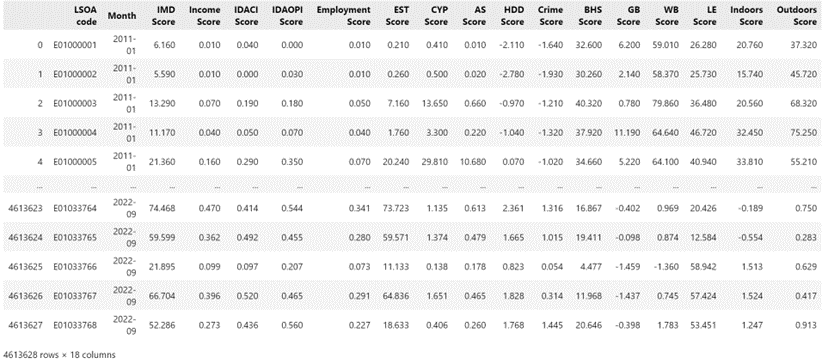 Figure 2: Snippet of Merged Deprivation Scores (2011 - 2022)
The datasets and detailed Python notebook for the data collection mentioned in this article is hosted in my Github Repo.