
The following article details the process on collecting inflation rate data in England from 2011-2022 in a single tabular file.
Inflation data in the form of consumer price inflation rates is provided by CPIH and can be downloaded directly either as a .csv file or a .xls file. Inflation rates are available from 2011 till 2022 on a monthly basis. The actual rows of data seem to be in some sort of mismatch form where data rows are provided first by year, followed by year and quarter, and year by month. Snippet of this data rows are depicted in Figure 1 below.
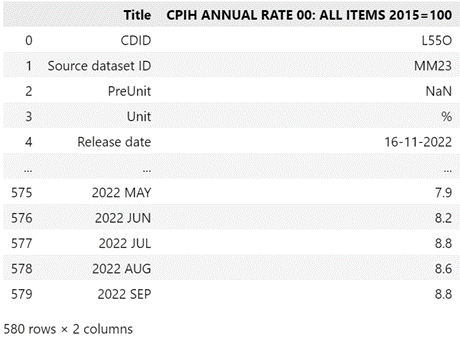 Figure 1: Snippet of Inflation Rates
Further data processing has to be done to ensure the year and month column obeys the format of ‘Year – Month (Numerical)’ desired for this project. This step is to ensure consistent format among all the datasets. The steps to transform the data from Figure 1 into a more usable structure are,
- Drop all irrelevant headers to the dataset
- The month row in Figure 1 is not in numerical form as was in previous datasets. To overcome this, a Python dictionary of months with the month names as the key and the month number as the value is created. An additional list of years from 2011-2022 is also created.
- Iterating through the dataset, the rows of data are checked for membership in the dictionary and list mentioned in step 2. If yes, the values of month from the dictionary are appended to a month list and the corresponding inflation rate is appended to an inflation list.
- A new DataFrame is now created using the resulting month and inflation lists from step 3.
The snippet of the processed inflation rates dataset is shown in Figure 2 below.
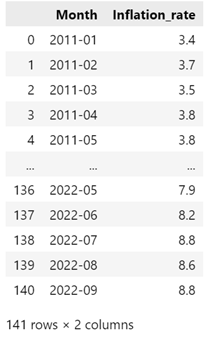 Figure 2: Snippet of Processed Inflation Rates
The sample dataset and Python notebook for the data collection mentioned in this article is hosted in my Github Repo.