
The following article details the process on collecting population density data in England from 2011-2022 in a single tabular file.
Population density in the simplest sense can be understood as the population estimate of each lower layer super output area (LSOA) divided by its land area in square kilometres. Population density data for each LSOA is provided by LSOA and the data is available from year 2011 till 2020. For the purposes of this project, data from year 2020 will be assumed for 2021 and 2022. File downloading options are a mix of both .xlsx and .zip files. Two custom Python scripts are written, with one to web scrape all the necessary files and another to merge all population density data in a single tabular file. The snippet of file downloading options is shown in Figure 1.
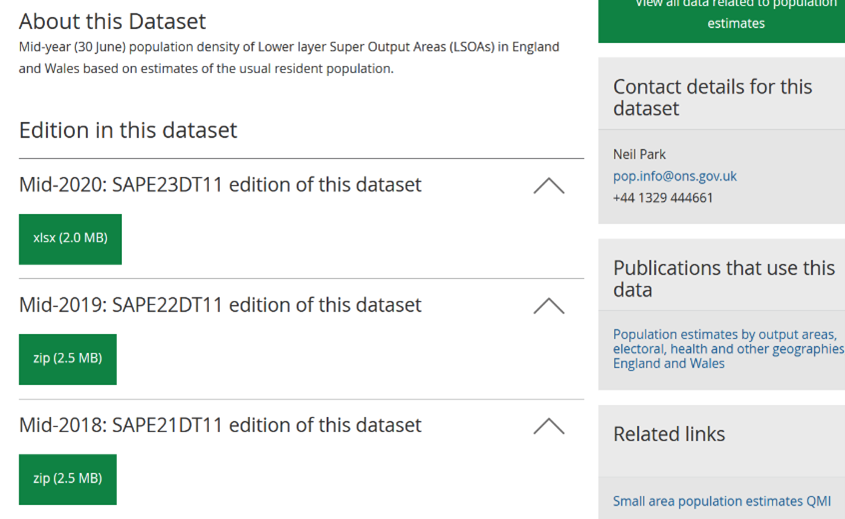 Figure 1: Downloading options for population density LSOA
Every downloaded data file consists of 5 main columns which are LSOA Code, LSOA Name, Year Population, Area Sq Km, People per Sq Km or population density to be exact. For the purposes of this project, only 3 columns are required, which are LSOA Code, Year-Population and People per Sq Km. Snippet of the population density from 2020 is shown in Figure 2 below.
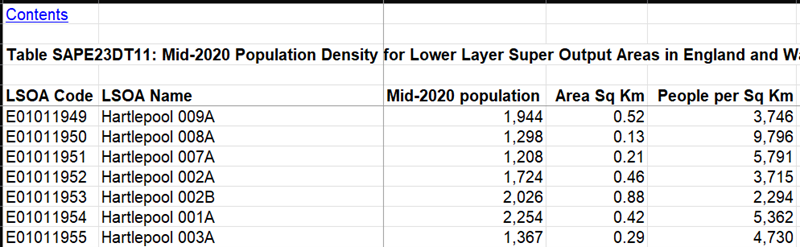 Figure 2: Snippet of Population Density from 2020
The basic idea of the steps taken to combine all required population density data in a single file is as below,
- Store 2020 population density data in a DataFrame and iterate through years 2020 – 2022 and months 1 – 12.
- Upon each iteration in step 1, the DataFrames for each year will be extended to cover for each month as well. A brief example for this is when a single DataFrame for 2020 is replicated 12 times for each month in a year.
- The DataFrame for each iteration shall be appended in a Python List and once the iteration process is complete, all the DataFrames in the Python List shall be merged into a single DataFrame of population density data from 2020 – 2022.
- Store 2011 population density data in a DataFrame and iterate through months 1 – 12.
- Upon each iteration in step 4, the DataFrames for the year will be extended to cover for each month as well.
- The DataFrame for each iteration shall be appended in a Python List and once the iteration process is complete, all the DataFrames in the Python List shall be merged into a single DataFrame of population density data for 2011.
- Repeat steps 4 – 6 for years 2012 – 2019.
- Merge all the DataFrames into a single DataFrame which can now be exported into a tabular format as population density data for years 2011 – 2022.
The snippet of merged population density data is shown in Figure 3 below.
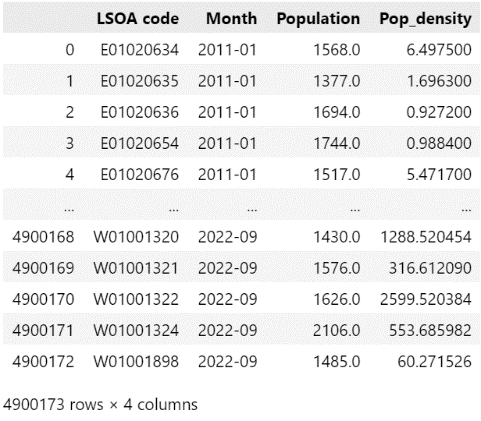 Figure 3: Snippet of Merged Population Density Data
The datasets and Python scripts and notebook for the data collection and data merging mentioned in this article is hosted in my Github Repo.