
This article briefly discusses the intricate relationships that exists between visualization and the human brain, and why scientists need to be better at it.
Background
Visualization is based on exploiting the human visual system as a means of communication. To understand this statement thoroughly, we first need to understand the core idea of said statement, visualization. What does it really mean though? Mnguni (2014) defines visualization as “the ability to select and effectively use a set of cognitive skills for perceiving, processing and produce visual models” (p. 2). The definition paints a good and simple picture of what visualization is without going into much details but needless to say, we are here to delve deeper. The following discussion shall attempt to explore visualization and its relationship with the human visual system.
Visualization, Human Brain and Mind
Imagine two similar information presented in a chart and in a paragraph of texts. The difference in time taken to absorb the information will be staggering. More specifically, the time taken for the information to be deposited in our memory. The information presented in a chart would take mere seconds for us to absorb. But, why is it? In order to understand this phenomenon, let’s look at a simple illustration that shows the flow of information to our memory (Figure 1).
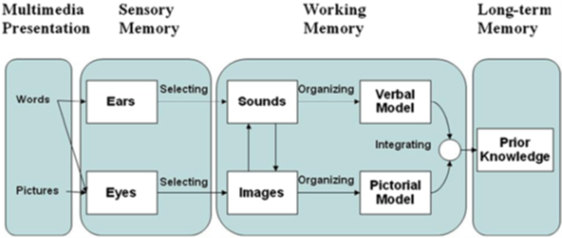 Figure 1: An illustration of the flow of information to human memory Mnguni (2014)
From (Figure 1), we can deduce that sensory memory via sensory inputs is the first phase in understanding visualization. According to (Schweizer, 2001), sensory inputs are governed by preattentive process which is in itself a process that is brought upon by external stimulation, but not to attentional selection. Schweizer (2001) goes on to conclude in his study that preattentive processes, to some level, affects processing time and cognitive ability. Supporting this statement, (Mnguni, 2014) posits that it only takes pre-attentive tasks 200 to 250 milliseconds to be performed and does not even need a high level of attention. In contrast, it took me 7 seconds to read and understand the previous sentence. (Figure 2) illustrates the mighty prowess of visualization.
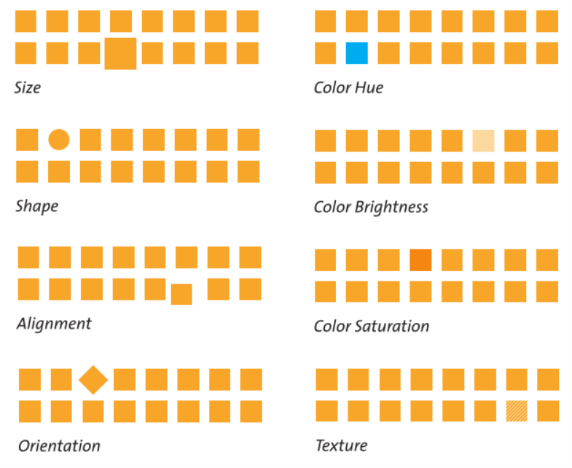 Figure 2: Illustration of Preattentive Processing Attributes (Hasanov, 2015)
Mnguni (2014) discusses something called Gestalt principles which describes how visual models are cognitively processed and four important factors that influence how humans group information together. (Figure 3), (Figure 4), (Figure 5) and (Figure 6) exemplifies the aforementioned principles.
 Figure 3: Closure principle in World Wide Fund for Nature official logo, where the mind has the tendency to complete the image even when some information is missing (Chapman, n.d.)
 Figure 4: Proximity principle, where the mind judge things to be as a unit if they are placed in close proximity (Chapman, n.d.)
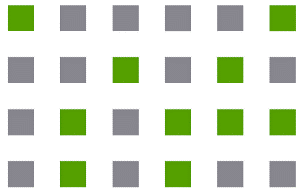 Figure 5: Similarity principle, where objects with similar shape, size, colour, texture and orientation are perceived as the same group even without any explicit rule saying there are (Chapman, n.d.)
 Figure 6: Simplicity principle, where the mind tends to understand objects in its simplest form. This illustration is comprised of unrelated individual elements but when viewed as a whole, we perceive it as ‘Logo’ (Busche, n.d.)
To demonstrate the high speed at which visualization is perceived by the sense of sight, we can refer to the works of Danish Physicist Tor Norretranders, who in his work titled, “Bandwidth of our senses” presented the speed of senses in computer terminology. The speed of sight is estimated at a whopping 1250MB/s. (Figure 7) is an adapted illustration based on said information.
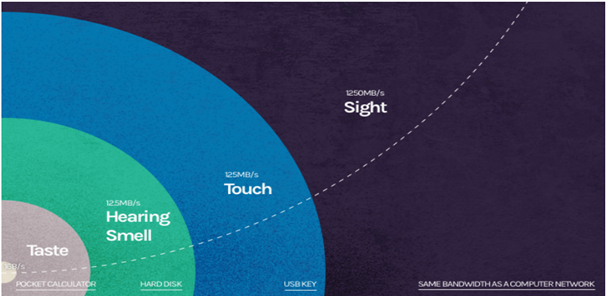 Figure 7: Adapted illustration of “Bandwidth of our senses” (Richard, 2015)
Why Scientists Need to be Better at Data Visualization?
Scientists bread and butter is to try and make sense of this vast universe and pass that knowledge on to fellow humans. Will people possibly grasp the complex information and data effectively without visualization to aid them? Speaking from my own experience, I doubt it. The case is more relevant at this present day and age where the world is getting drenched and soaked with data of unspeakable proportions at the rate that would overwhelm us just by thinking about it. We have explored the power of visualization but is it really being utilized to its potential? The visualization that comes with most scientific publications are among the last things being done and to quote data visualization scientist Seán O’Donoghue, “Visualization is seen as really just kind of an icing on the cake” (Mason, 2019, para. 4). This practice will confuse readers and mislead the scientists themselves (Mason, 2019). The following illustrations will hopefully shed some light.
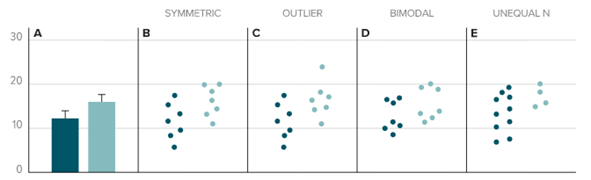 Figure 8: Graphs from B-E can be represented exactly by graph A showing how information can be missed out by opting for bar chart (Mason, 2019)
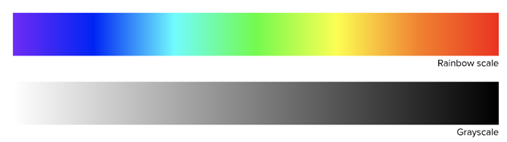 Figure 9: Commonly used colour scale is the rainbow scale but is perceived unevenly by humans and may misrepresent information compared to grayscale which is consistent in terms of shade (Mason, 2019)
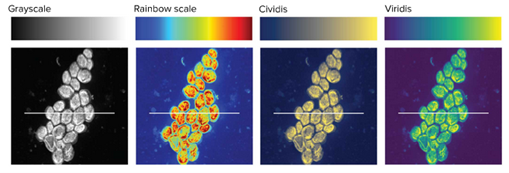 Figure 10: Microscopic image of yeast cells illustrates the contradictory nature of rainbow scale. Cividis and Viridis colour scales are meant for better representation with Cividis designed to be legible for colour blind people (Mason, 2019)
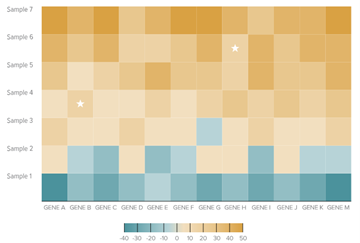 Figure 11: The two starred squares are of identical shades but does not appear so due to a phenomenon known as simultaneous contrast (Mason, 2019)
Figures 8 to 11 presents just the tip of an iceberg that has the potential to misinform the general public. Prolonging this culture, scientists generally are inclined to follow precedent and are not formally trained in data visualization, with some institutions not even offering it as a requirement (Mason, 2019). With the ever-increasing wealth of information, scientists need to set the standard in publishing data that works along with the brain, not against it.
How can Interactive Data Visualization Help?
Interactive data visualization allows users to manipulate and interact with the data in real time allowing business intelligence (BI) executives to assist them in making better decisions (Luo, 2019). To understand what kind of help interactive data visualization actually provides, we need to explore the benefits of it.
- Faster Trend Identification
- Directly manipulating the data allows the user to act on valuable information as they can understand and identify the trends faster (HEAVY. AI, n.d.)
- Efficient Relationship Identification
- Users are able to distinguish cause and effect relationships more interactively within modifiable timeframes (Synergy Codes, 2021)
- Beneficial Data Storytelling
- By having the ability to modify data and view them in real time, users are able to take advantage of the fact that humans understand data better through multiple perspectives (HEAVY. AI, n.d.)
- Complex Data Simplification
- The presence of interactive controls can provide order and valuable insights by allowing the users to engage with the data directly while simplifying the large datasets for better understanding (Synergy Codes, 2021)
Perspectives
The purpose of this discussion is to discuss how visualization is based on exploiting the human visual system as a means of communication and this discussion has highlighted several points in regards to that. Particularly, the relationship between visualization and human brain, imperative of why scientists need to be better at data visualization and how can interactive data visualization be a cause for benefit. All those points pave the way for significant development in the field of visualization and not only for scientists publishing research articles or business executives identifying market strategies, but should be adapted en masse in students’ education syllabus and importantly media groups. It is undeniable that the general public are getting consistent streams of data from social media with media groups among the big players in sharing their content and they need to take responsibility in how their data are visualized. We have already seen how amazingly simple it is to mislead and misinform data with visualization. To paraphrase a statement earlier from this discussion, we as a whole should be working in making something that goes along with the brain, not against it.
Works Cited
- Mnguni, L. E. (2014). The theoretical cognitive process of visualization for science education. http://www.springerplus.com/content/3/1/184
- Schweizer, K. (2001). Preattentive processing and cognitive ability. https://doi.org/10.1016/S0160-2896(00)00049-0
- Hasanov, H. (2015). Visualization principles. A quick intro to data visualization. Medium. https://hasanoviz.medium.com/visualization-principles-a8c6e46ddc5f
- Chapman, C. (n.d.). Exploring the Gestalt Principles of Design. Toptal. https://www.toptal.com/designers/ui/gestalt-principles-of-design
- Busche, L. (n.d.). Simplicity, symmetry and more: Gestalt theory and the design principles it gave birth to. Canva. https://www.canva.com/learn/gestalt-theory/
- Richard, K. (2015). Data Visualization: Processing Images at 1250MB/s. Wiredcraft. https://wiredcraft.com/blog/data-visualizations-images/
- Mason, B. (2019). Why scientists need to be better at data visualization. Knowable Magazine. https://doi.org/10.1146/KNOWABLE-110919-1
- Luo, W. (2019). User choice of interactive data visualization format: The effects of cognitive style and spatial ability. Decision Support Systems, 122. https://doi.org/10.1016/j.dss.2019.05.001
- HEAVY.AI. (n.d.). What is Interactive Data Visualization?. HEAVY.AI. https://www.heavy.ai/technical-glossary/interactive-data-visualization
- Synergy Codes. (2021). What is Interactive Data Visualization And Its Benefits. Synergy Codes. https://synergycodes.com/blog/what-is-interactive-data-visualization-and-its-benefits/