
The following article details the process on collecting crime rate data in England from 2011-2022 in a single tabular file. The pre-requisites for this project include the Crime Incident and Population data which can be accessed via my previous posts in this site.
The basic idea of deriving crime rates from crime incident data are outlined in the steps below,
- Loading the crime incident data in a Pandas DataFrame
- Adding a ‘Count’ column with a value of 1 for all rows to label each incident as 1 count of crime incident.
- Saving the DataFrame in a new DataFrame with only columns of Month, LSOA code and Count.
- Perform a Pandas groupby method to derive the total crime counts by month and LSOA code.
- Loading the population data in a Pandas DataFrame.
- Merge the DataFrames from step 4 and step 5 using Month and LSOA code as the joining key.
- As in previous research, the average population of each LSOA is 1500 and adapting that number into the general crime rate formula gives us, Crime Rate = crime/population × 1500
- A new column ‘Crime Rate’ is created by applying the formula in step 7 on each row.
The snippet of the crime rate data is shown in Figure 1 below.
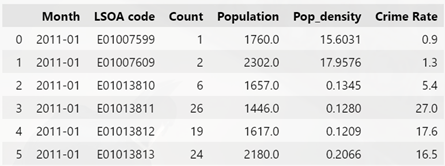 Figure 1: Snippet of Crime Rate Data
The Python scripts mentioned in this article are hosted in my Github Repo